Broker reports are broken. See what I did there? Brrrroooooke – r- n.
As a broker have you ever wondered what to do with your website analytic reports at the end of the month? You know the one. It tells you how much traffic came to your website, how much of that traffic was robots, where in the world that robot traffic originated and what pages were the robots really enjoying the most? Some companies have even made some nice accompanying graphics and charts for those stats, you know, to make them more user friendly. Wheeeeee charts.
So what do you do with that report after you’ve looked at it? That’s what I thought. Nothing. Because there’s literally not much you can do. And I won’t say the cat litter box thing that everyone always says here. So, sure they say you can change the content out on your pages and add some more call to action graphics. Oh. And they also say you should blog. Like, blog a lot! All that will definitely help. But what does it help? Go ahead, say it out loud. Nothing.
Well, sure it helps you get more traffic, but how does it help you add more value to your agents careers? How does traffic give you real insights into what actual consumers want from a listing page, profile or communication?
Remember “that” guy that won the race in Grade 1. Every. single. damn. race. What’s he doing now? That’s what I thought – who cares. He doesn’t matter either and what we’re kind of saying to you is; you got us, neither do your website statistics as they relate to fervently awaiting monthly traffic reports to see if you’re finally number one for “real estate brokerage that sells houses in X-land”. You have other ways to check this, just in case you eagerly await your stats each month to see which position you’re in. You could Google it yourself. Any time really – day or night.
So what does count? Well, obviously that’s why I’m here. I want to sell you the next shiny thing you didn’t know you needed. A neeeewwwww kind of stat tracker. The SYNCRO Canary Stat Tracker for Brokers. Sounds like a mouthful, but unless the cat’s got your tongue, this means that Canary is going to give you some singingly, sweet stats, and these…these little gems will be the A-ha! kind of stats you’ve been missing. They’re going to make you a broker-super star. Why?
Because Canary will give you results. Results that will help your agents – become better agents.
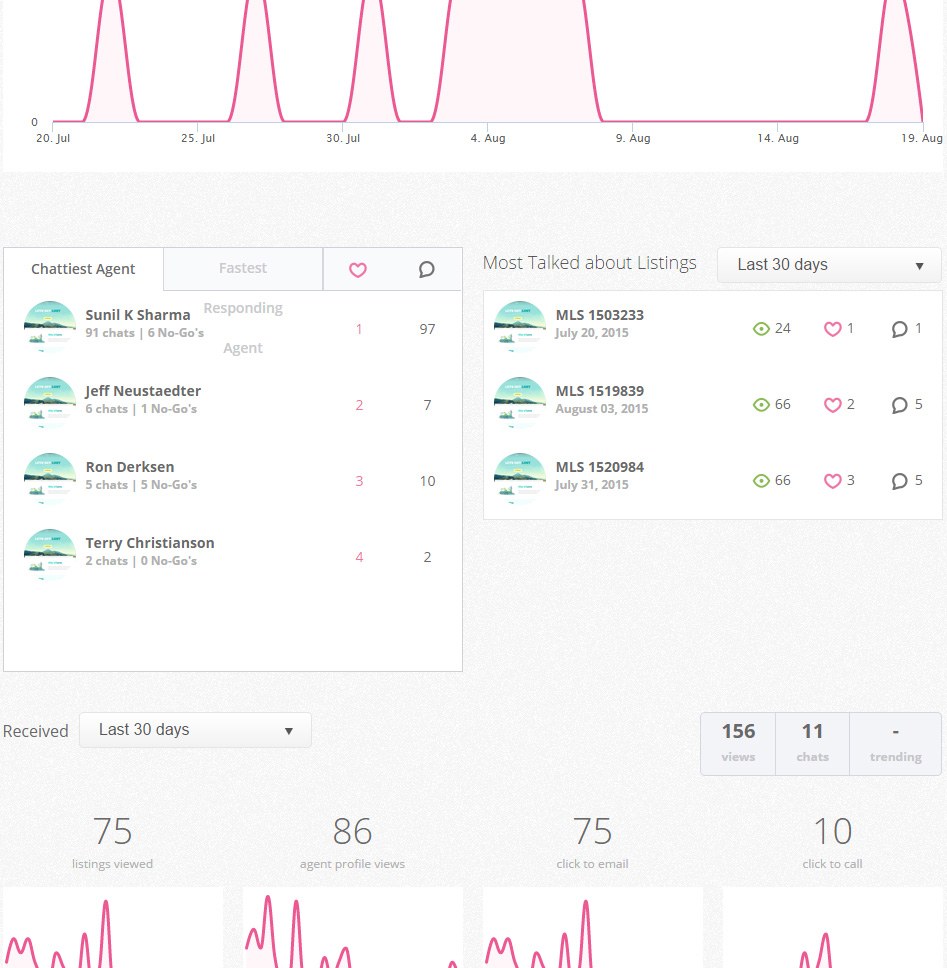
We’re all about giving you real time, real valuable information; like what listing received the most chats and what can we do (aside from building an exact replica of the home getting the most action) to make other listings look like this one to encourage more chats? Maybe hire the same photographer for all your agents would be a start. Or maybe the listing description needed a longer, more descriptive copywriter. Too many photos? Bad agent mug shot?
 There are plenty of stats to sink your teeth into surrounding this stat alone, and there are yet dozens of stats just like these to keep you more efficient and more productive as a real estate Broker. Like who was the least chattiest agent. What was different about their profile? Is it simply listing volume or can you make adjustments to a more streamlined profile? Was it something the agent said in his/her messaging that lead to more cancelled chats? Because oh yeah. We do that too. You can view all the chat history that came in each month. This will help you to spot check your valuable agents to ensure that they don’t need any coaching on chat to text etiquette. Coaching they might even get from another Broker looking to poach the hard work and training you’ve already invested, for false promises to greener pastures.
So, sure. You can keep on, keeping on with those boring and kind of useless website traffic stats, or, you can sing like a Canary and get stats on things that really matter for your brokerage.
For a full description of what other stats are provided and how to get them working for you for less than a cup of coffee per agent per month, please SYNCRO us now to arrange a demo.
